
I have been asked by a number of energy auditors and building commissioning agents, “What tools are freely available to benchmark commercial buildings?” The more you dig into the question, the more tools you find. In this post, I’ve laid out a summary of some of the most prominent free tools, their features, and my general impressions. I’ve specifically avoided residential benchmarking tools.
[hr]
What is benchmarking?
Management consultant Peter Drucker once famously stated, “What gets measured gets managed.” This adage is as true in operating buildings as it is in weight loss or balancing a budget. You cannot manage the energy use and performance of a building unless you first take the time to measure it. Utility bills by themselves provide an extremely opaque measurement of a building’s energy performance because they lack context. [pullquote_right]Utility bills by themselves provide an extremely opaque measurement of a building’s energy performance because they lack context. [/pullquote_right]Reading the numbers off a utility statement for a given month provides little insight into the relative energy efficiency of a facility, because individual meter readings and utility costs don’t account for the myriad factors that influence a building’s energy use. What if the weather was warmer or colder than usual? What if I operate a building that’s necessarily energy-dense, like a grocery store or a hospital? Is 20,000 kilowatt-hours a big or a small number for my facility?
To make fair apples-to-apples comparisons of building energy use requires benchmarking. Building energy benchmarking is a process that examines the energy use trends of a building over time and normalizes for factors like weather and square footage to provide a fair yardstick for continuous energy efficiency improvements. (If you want a really good summary of how benchmarking works, particularly the weather normalization part, I’d suggest checking out some of the more detailed tools and tutorials compiled by Oak Ridge National Lab.)
Why building owners and operators should benchmark
[pullquote_left]Energy benchmarking is the bare minimum entry point for energy management in commercial buildings.[/pullquote_left]Energy benchmarking is the bare minimum entry point for energy management in commercial buildings. Before facilities start installing fancy automation systems, upgrading HVAC equipment, installing daylighting sensors, and all the rest, they first need to know where they stand compared to their peers. If building operators and executives with budget oversight of corporate real estate instead managed financial portfolios, they would likely compare their performance against some standard index like the S&P 500 or Dow Jones Industrial before looking to exotic investments for additional returns. The same is true in buildings.
This basic investment in tracking and analyzing energy use trends can help individual facilities compare themselves against “normal” energy use trends and determine whether significant energy and cost savings are possible. As facilities begin tracking normalized energy use data over time, they can identify sudden shifts in energy use trends that – combined with other information such as comfort complaints and building automation system data – could signal equipment failures. For larger organizations and commercial property owners, benchmarking across a fleet of similar buildings can be an invaluable decision support tool to identify “loss-leader” facilities with the greatest energy and OPEX savings potential.
Data recently analyzed by the U.S. ENERGY STAR program suggests that benchmarked facilities can expect to consistently reduce their energy consumption over time. Their 2012 analysis of over 200 commercial buildings demonstrated an average 7% energy reduction between 2008 and 2011. Facilities with high starting energy use indices (EUIs) generally saved the most over this period (over 10%), whereas the most efficient facilities had far less opportunity (less than 5%). These savings didn’t happen on their own, of course. The likely required maintenance, changes in facility operation, or even equipment retrofits to be realized. However, I think it’s fair to say that benchmarking provided the informational foundation that led to most of those savings.
Some municipalities, like Seattle, have even started requiring that non-residential buildings conduct annual energy reviews using standardized benchmarking tools.
A roundup of current free tools
Many of the lists of online benchmarking tools that I’ve found around the web have gone stale or are extremely dated in their approach. Below are some of the best tools out there.
Noesis Energy: Noesis Energy is one of the most intriguing energy efficiency and energy management startups out there today. They offer what I’ve seen described as a “freemium” model for energy management software. In other words, they provide a lot of energy management tools for free, then offer expert services layered on top of this for a fee. One of the coolest features: Noesis Data Services, which maintains integration with meter data management systems (MDMS) from over 600 utilities and, for a fee, will automatically import a facility’s consumption data into your account on a continuous basis. Another interesting thing about Noesis is that it is really both a software tool and an online community of energy managers, consultants, and building operators. I won’t go into those other aspects here, but encourage you to check them out for yourself.
As for benchmarking, Noesis adheres to ASHRAE Guideline 14, an industry-standard measurement and verification guideline, to generate a weather-normalized “model” of individual facilities (assuming they have sufficient historic utility bill data). Using this information, Noesis offers several benchmarking tools that can compare facilities across your portfolio and rank your facilities against a peer group derived from US DOE’s Commercial Building Energy Consumption Survey (CBECS). The portfolio ranking capabilities are pretty basic, allowing users to sort a list of buildings by various attributes, such as climate region, energy use intensity (EUI), etc. The real power of the tool is that Noesis lets you compare buildings on a weather-normalized, typical year basis rather than just on actual usage, as shown in the demo below.
Noesis’ peer comparison tool is clean, light, and easy to use. Similar to the EnergyIQ discussed below, it enables you to make comparisons between your facility and a peer group. Comparisons can be made by fuel type and even for water as well. However, the current version does not allow for the kind of fine-grained control of peer group attributes that you see in the EnergyIQ tool.
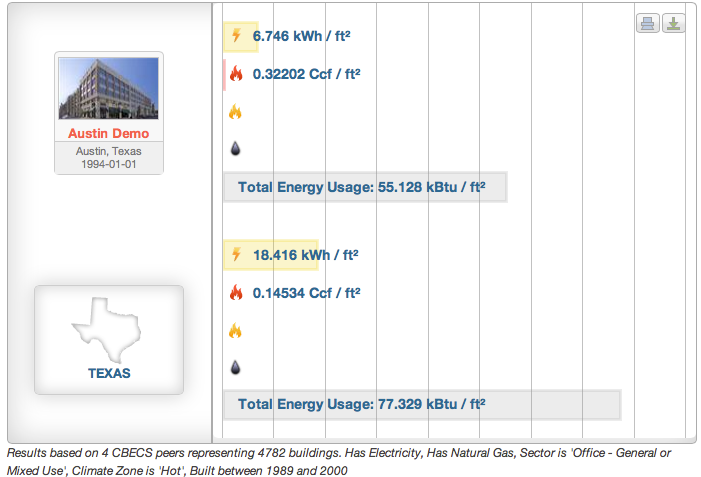
A Noesis Energy peer group comparison for an Austin, TX office.
Finally, as we will see with the EnergyIQ tool, Noesis allows users to import existing ENERGY STAR Portfolio Manager data, so you can avoid the need for double data entry.
EnergyIQ: EnergyIQ is an ongoing commercial benchmarking web project from Lawrence Berkeley National Laboratory. The tools three main functions are benchmarking, portfolio tracking, and rough analysis of energy savings potential for a set of broadly applicable energy savings measures (still a work in progress as of this writing). The tool uses either CBECS or California End-Use Survey (CEUS) data to help you build a picture of typical energy consumption for your type of building, aka a cohort. You can choose your cohort based on a variety of attributes, including vintage, square footage, usage type, and climate region (I recommend casting the net very broadly when first generating a cohort, lest you end up with a dataset based on half a dozen buildings).
To benchmark a building, users first select the metric they wish to use for comparison. This could be total facility fuel use, total electric use, or energy use by a given end-use category. Next, users select attributes of their facility to develop the cohort against which a facility will be compared.
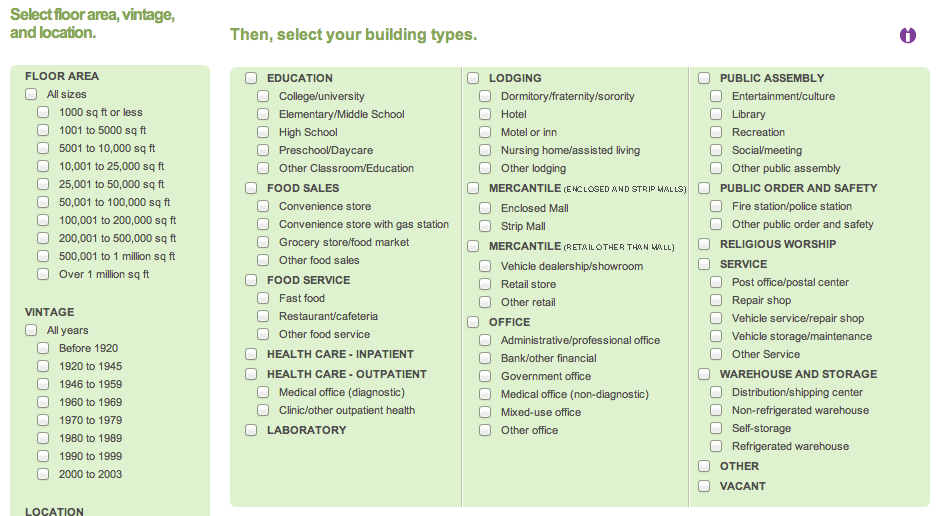
Attributes can include building vintage, type, square footage, etc.
Once you have selected a peer group, EnergyIQ generates associated charts to show the range of energy use for your peer group. The chart below provides a sense of the distribution of energy use within your peer group, showing where the median (midpoint energy use) and quartiles (data ranked divided into quarters) are located. You can then add buildings to the chart to show where your facility stands.
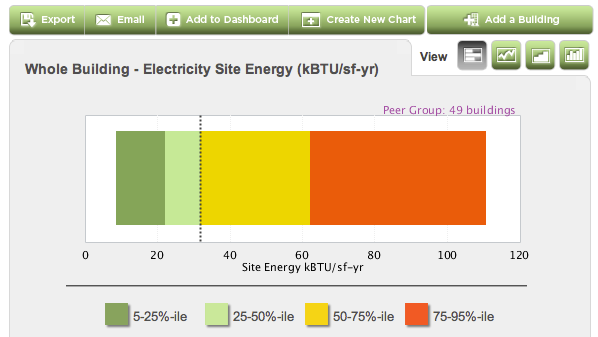
This bar chart shows the distribution of energy use in the peer group selected.
EnergyIQ lets you store and track data on a portfolio of buildings saved to your account. You can create custom dashboards for those buildings, using metrics and peer groups that you have defined. The current implementation is not entirely without bugs, but it looks really promising. The compact dashboard charts are also innovative, clean, and easy to read once you get comfortable with them. If you’re one of the many folks who use ENERGY STAR’s portfolio manager, the program has been designed to import data that’s already been entered there.
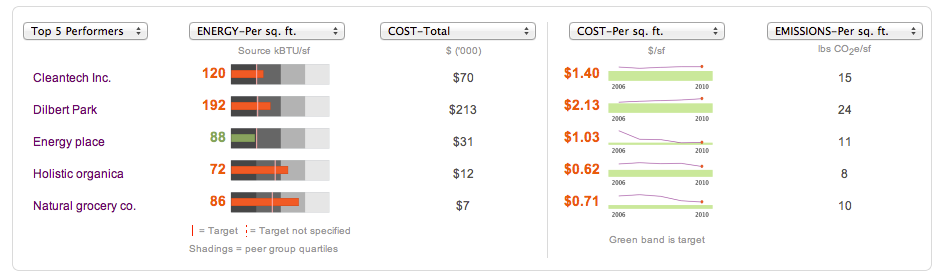
EnergyIQ lets users track a group of facilities using nicely designed dashboards.
Finally, developers can tap into EnergyIQ’s API to leverage its benchmarking capabilities in other, customized applications.
ENERGY STAR Portfolio Manager: Since ENERGY STAR Portfolio Manager is probably the most widely used benchmarking tool out there, I will not go into great detail on it. Needless to say, facilities will continue to need to use Portfolio Manager because it is part of the path to earning the ENERGY STAR label for commercial facilities. A small industry has grown up around Portfolio Manager to automate and ease the data entry burden for portfolios of buildings. It lacks many of the nicer user interface and ease-of-use features that some of the newer tools have to offer, but it still employs a similar benchmarking and peer comparison methodology that ties back to CBECS data comparisons.
Benchmarking’s Achilles heel
When it comes to commercial building benchmarking, you will notice a thread that runs through all of the tools above. When making performance comparisons or even assigning an ENERGY STAR label to a building, everything currently ties back to the DOE’s CBECS data. This is the best snapshot we currently have of national commercial building energy performance, but it’s not without its weaknesses.
Gathering energy consumption information and building attributes on a statistically meaningful sample of buildings from across the nation is an onerous and slow process – so slow, in fact, that the last complete update to CBECS was made in 2003 (efforts are currently underway to obtain a new sample). The next most recent survey was conducted in 1999. It is now 2013, and I am not suggesting that the commercial building stock has changed so dramatically in the intervening time, but I would say that a decade-long refresh cycle is probably inadequate. To be fair, part of the reason for this slow cycle is that CBECS is a government-funded effort and is subject to the political winds in Washington D.C. (funding was in question for a long period, hence the delay in the current survey).
Another issue I see with CBECS is that its scope is so incredibly large that it can only afford to provide very coarse data on any meaningful peer group one might choose. For example, if you truly want to compare a building to other peer facilities, you would want to account for factors like vintage, size, usage, and climate region. The problem with CBECS is that, once you’ve taken all these factors into account, you might end up with a peer group of only half a dozen buildings (this recently happened to me when trying to benchmark a small grocery story with EnergyIQ).
For benchmarking to be even more meaningful, building owners will need to be able to compare themselves against other buildings in their region of a similar vintage, using information that is less than a decade old. This could come from unique utility program efforts, energy management service providers with large “data warehouses” (see Ecova’s thinking on this and note how EUIs for their customers are shifting over time), or – and this is a long shot – government-funded efforts.